(This page is also available in French)
Safecast.org & RadexRead Software joined map of radiation measurements, updated by our customers.
Safecast.org & RadexRead Software joined map of radiation measurements, updated by our customers.
With RD1212 Advanced Geiger Counter you can plot your radiation readings right onto the map!
Share your radiation readings and see what the others have been finding too. Join the global community of concerned people just like you who can now share the data from their Advanced Geiger Counter by plotting it on the World Map by using Radex Read Software .
Share your radiation readings and see what the others have been finding too. Join the global community of concerned people just like you who can now share the data from their Advanced Geiger Counter by plotting it on the World Map by using Radex Read Software .
A free new application developed by Quarta Rad which allows users to properly store, analyse and share data from their RD1212 Advanced Geiger Counters.
What the RadexWeb application can do:
What the RadexWeb application can do:
- Read data from RD1212 and see it on your PC.
- Store the readings you took on your PC or share them on a server.
- With one click – Assign Location to your data in our International Database.
- Show all data from other users on the World Map.
- Save your data for personal use only.
- Chart your data for specific location vs specified time period.
- Save your data for the world to see in Common International Database.
- Quick and easy access with a Customizable Interface.
This how it works:
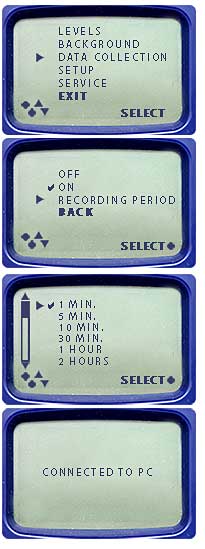
Turn the RD1212 - ON
MENU → DATA COLLECTION → ON
MENU → DATA COLLECTION → RECORDING PERIOD: 1 min
You should also designate the Recording Period, also found in the Data Collection menu. For now, we will set it to 1 minute. That means that every minute the unit will store the latest reading in its memory.
The unit can store up to 160 readings.
Press BACK twice (to the main scanner window)
Take measurements for 5 - 10 minutes
After about 10 minutes of your unit taking and recording data on the surrounding radiation, it is time to analyse it on your PC.
Tip: If you wish to share this data later with the world, please consider taking your readings in the open spaces like public parks and playgrounds, not just inside your home. This way you data will be really helpful to others who may visit the same locations you do.
Download and Install the RadexRead drivers for Mac or PC.
After the drivers have been downloaded, you may need to Restart your browser.
Also, launch the RadexServer - it is required for RadexWeb to recognize that the unit is plugged in.
Connect RD1212 to your computer with USB Cable.
With the unit turned on, connect via the provided USB cable to your PC's USB port.
The unit's screen will read "Connected to PC".
Go to RadexWeb on-line application
Assign Device Data
Now we can assign this data to a real map location.
- Place checkmarks next to all readings on your list that you wish to assign to a map location.
- Click on the Map window and position the Pin over the desired location.
- Each time you click - the Pin will move
Tip: you can zoom in and out of the map by using the scrolling wheel on your mouse. Try to be as precise as possible.
Set Location
You have a choice of sharing this data and location with all other users by saving this assignment to our International Database, or you can choose a more private option of saving this data only for your personal use.
Save to QuartaRad.com: Click the Save to button in the middle panel and choose QuartaRad.com
NOTE: This action is permanent and cannot be undone!
Save to File: for personal use only. Saves as a Table TXT file.
Save to QuartaRad.com: Click the Save to button in the middle panel and choose QuartaRad.com
NOTE: This action is permanent and cannot be undone!
Save to File: for personal use only. Saves as a Table TXT file.
Charting Data
Once your measurements have been assigned to location, you can create an easy-to-analyze chart to review your data.
You should see the chart displaying your data.
- Click the View Chart button in the top menu.
- Click and drag over the Map to select desired data locations.
- Then, choose the time period in the pop-up window.
You should see the chart displaying your data.